
1. Executive summary
Lighthouse
Mobile
99.1 / 100
Lighthouse
Desktop
99.2 / 100
PageSpeed Insights
Mobile
98.6 / 100
PageSpeed Insights
Desktop
99.0 / 100
Check your own website: Free Website Health Check. These results describe our Eleventy-built website, not a guarantee of scores for client websites, which may use different technology.
Your website should work as hard as you do
When someone visits your business website, they want to find information quickly, understand what you offer and contact you without unnecessary difficulty.
If a website loads slowly, displays poorly on mobile phones or behaves unpredictably, potential customers may become frustrated and leave before making an enquiry.
At On The Map Digital, we believe professional website design should combine attractive presentation with speed, accessibility, technical quality and ease of use.
We apply these principles to our own website.
In October 2026, we assessed 18 pages of our website using Google Lighthouse and Google PageSpeed Insights.
Testing covered mobile and desktop devices, producing 72 recorded assessments.
Our performance results
If columns extend beyond the screen, scroll within the table. Keyboard users can focus the table and use the arrow keys.
| Assessment | Mobile average | Desktop average |
|---|---|---|
| Google Lighthouse | 99.1/100 | 99.2/100 |
| Google PageSpeed Insights | 98.6/100 | 99.0/100 |
Other key achievements
SEO: 100/100 across all 72 recorded assessments.
Best Practices: 100/100 across all 72 assessments.
Accessibility: 17 of 18 pages originally achieved 100/100. The remaining page was corrected and subsequently retested at 100/100.
Agentic Browsing: All 72 assessments recorded passes for all three included checks.
These results demonstrate consistent technical performance across the website, rather than relying on a single highly optimised homepage.
What does this mean for customers?
Our results demonstrate the technical standards we aim to apply when building websites for small businesses: efficient loading, responsive design, accessible content and reliable functionality.
Although performance scores alone cannot establish increases in enquiries or sales, they provide valuable evidence of a website's underlying technical quality.
2. Why Website Performance Matters to Your Business
- Find a business
- Read services
- Make an enquiry
A clear, responsive website supports each stage of the customer journey.
A website is often your customer's first impression
Imagine someone searching on their phone for a local plumber, electrician, landscaper or other service provider.
They find your business and open your website.
They expect to understand what you offer, whether you cover their area and how to contact you.
If the page takes too long to display, the navigation is difficult to use or important information moves unexpectedly, that experience becomes frustrating.
A technically well-designed website helps remove these obstacles.
The practical benefits of good website performance
Faster access to information
Efficient pages help visitors reach service descriptions, contact details and other important information without unnecessary waiting.
A better mobile experience
Responsive design helps customers browse your website on phones and tablets, not just desktop computers.
Easier navigation
Clear page structures and responsive controls help visitors find what they need.
Greater visual stability
Stable layouts reduce unexpected movement of text, images and buttons.
A stronger technical foundation
Well-structured websites are easier for search engines to process and can support future improvements.
These are potential usability benefits, not measured increases in enquiries or revenue.
Why we test mobile and desktop separately
A website that performs well on a powerful desktop computer may behave differently on a mobile device.
Mobile tests can simulate more constrained devices and network conditions, helping identify problems that might otherwise be missed.
That is why our assessment includes both device categories for every page.
3. Our Website Performance Results
Testing the entire website
We assessed 18 website pages rather than selecting only the pages most likely to achieve high scores.
The assessment included the homepage, service pages, customer enquiry pages, business information, location pages and legal information.
Mobile performance
If columns extend beyond the screen, scroll within the table. Keyboard users can focus the table and use the arrow keys.
| Testing tool | Average performance | Recorded range |
|---|---|---|
| Google Lighthouse | 99.1/100 | 97–100 |
| Google PageSpeed Insights | 98.6/100 | 91–100 |
Desktop performance
If columns extend beyond the screen, scroll within the table. Keyboard users can focus the table and use the arrow keys.
| Testing tool | Average performance | Recorded range |
|---|---|---|
| Google Lighthouse | 99.2/100 | 93–100 |
| Google PageSpeed Insights | 99.0/100 | 89–100 |
These results show strong overall performance across the tested pages.
Score guide: 90–100 good (green); 50–89 needs improvement (amber); 0–49 poor (red). These are Lighthouse category bands, not a measure of business success.
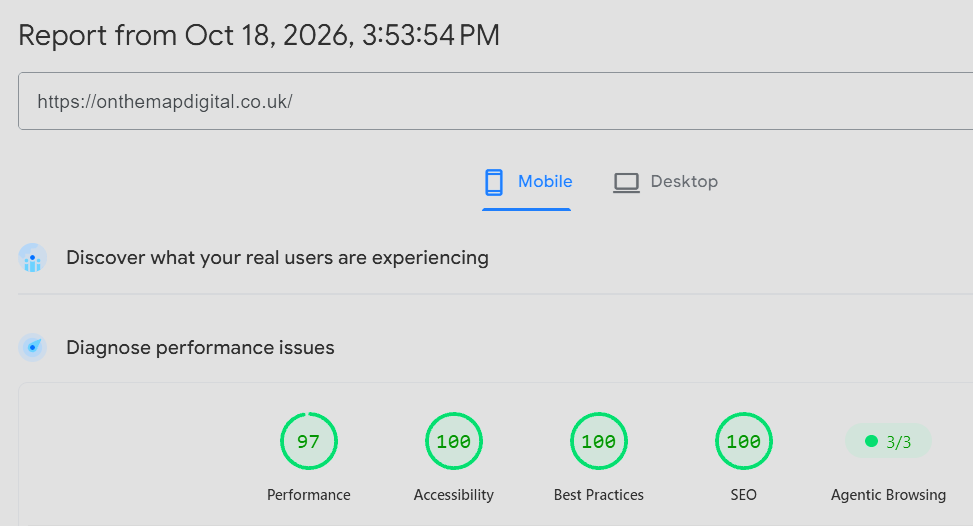
Homepage PageSpeed Insights mobile, 18 October: Performance 97; other category scores 100.
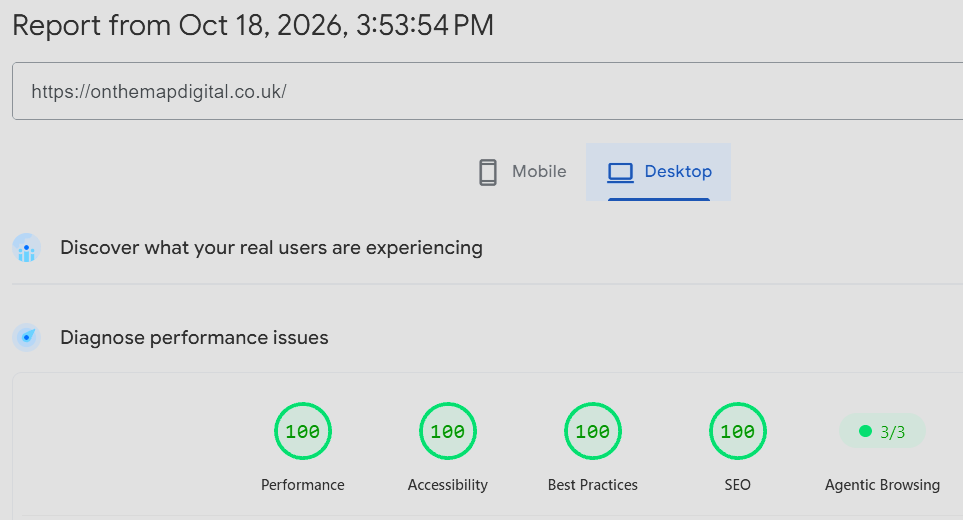
Homepage PageSpeed Insights desktop, 18 October: all four category scores 100.
The averages are calculated from the individual recorded scores. They are not separate Google-issued site-wide performance ratings.
Why scores can differ
Google Lighthouse is an automated website-quality testing tool. PageSpeed Insights uses Lighthouse for lab tests and may also provide separate real-user data. Results can vary with testing conditions.
A performance score is a useful diagnostic measurement, not a permanent characteristic of a website.
Our own testing identified one unresolved difference between desktop PageSpeed Insights and local Lighthouse results on the About Us page. We document this in Section 8.
What this means for your business
A professional website assessment should examine several pages and device types, rather than relying on one favourable test result.
4. Understanding Website Speed and Core Web Vitals
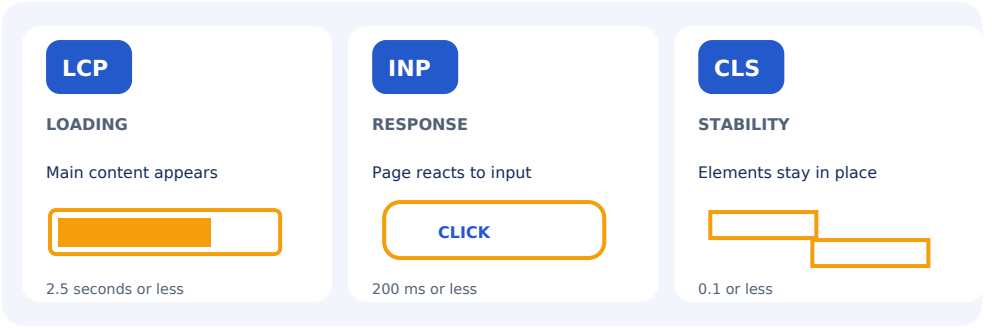
Technical performance reports often contain unfamiliar terminology.
Here are the measurements that matter and what they mean in everyday language.
Largest Contentful Paint (LCP)
How quickly does the main content appear?
LCP measures how long it takes for the largest visible content element to appear.
For a business website, this might be the main heading, a prominent image or another substantial element near the top of the page.
A good LCP result helps indicate that visitors can see the main content promptly.
Interaction to Next Paint (INP)
How quickly does the page respond when someone interacts with it?
INP assesses responsiveness using actual interactions.
For example, a visitor might open a menu, select an option or interact with a form.
Good responsiveness helps make those actions feel smooth and predictable.
INP is a real-user metric. Standard Lighthouse navigation tests do not independently establish real-user INP performance.
Cumulative Layout Shift (CLS)
Does anything unexpectedly move while the page loads?
CLS measures unexpected changes in the position of visible page elements.
For example, a button might move just as someone attempts to select it.
Reducing these shifts makes pages easier and less frustrating to use.
What counts as good?
Google's recommended Core Web Vitals thresholds are:
If columns extend beyond the screen, scroll within the table. Keyboard users can focus the table and use the arrow keys.
| Metric | Good threshold |
|---|---|
| Largest Contentful Paint | 2.5 seconds or less |
| Interaction to Next Paint | 200 milliseconds or less |
| Cumulative Layout Shift | 0.1 or less |
For real-user Core Web Vitals reporting, these thresholds are assessed at the 75th percentile of relevant page visits.
These are laboratory results, not verified real-user Core Web Vitals. On 14 October, homepage LCP was 1.3 seconds on mobile and 0.8 seconds on desktop in Lighthouse; PageSpeed Insights recorded 2.7 seconds and 0.5 seconds respectively. LCP measures when the largest visible content appears, not full page load.
The customer benefit
Good loading speed, responsiveness and visual stability help create a smoother browsing experience, particularly when visitors are trying to find services or contact a business.
5. Accessibility, Search Engine Optimisation and Technical Standards
Accessibility: Helping more people use your website
An accessible website aims to make information and functionality usable by people with different abilities and assistive technologies.
Automated accessibility testing can identify problems such as insufficient colour contrast, missing accessible names and certain structural issues.
Our accessibility results
The original October assessment recorded 100/100 accessibility on 17 of the 18 pages.
The Website Maintenance page scored 96/100 because of insufficient contrast between the orange background and part of the text in a pricing badge.
We corrected the text colour, improving the contrast ratio:
Before: 3.02:1
After: 5.78:1
The corrected contrast exceeds the applicable WCAG AA minimum of 4.5:1.
On 18 October 2026, both Lighthouse and PageSpeed Insights returned 100/100 accessibility on mobile and desktop for the corrected page.
This illustrates an important part of our development approach: identifying an issue, making a targeted correction and verifying the outcome.
A 100/100 automated accessibility score does not establish full WCAG compliance. Manual evaluation and testing with assistive technologies remain important.
Search Engine Optimisation: 100/100
All 72 recorded assessments achieved 100/100 in the Lighthouse SEO category.
Our website incorporates technical SEO practices including:
Search-friendly page structures and URLs.
Relevant titles and descriptions.
Structured headings and content.
Mobile-responsive layouts.
XML sitemap and robots.txt configuration.
Structured data describing the business.
HTTPS delivery.
These elements help provide a sound technical foundation for search visibility.
Does 100/100 mean SEO is complete?
No. Lighthouse evaluates a defined set of technical checks.
Successful SEO also depends on useful content, search intent, competition, website authority and other factors.
Best Practices: 100/100
All 72 assessments also achieved 100/100 for Best Practices.
These checks examine selected aspects of modern browser compatibility, implementation and security-related practices.
They provide useful technical evidence but should not be interpreted as comprehensive security certification.
6. AI and Agentic Browsing Readiness
Recorded homepage audit evidence, 18 October 2026
Preparing for new ways of finding information
People increasingly use AI-powered search tools and automated assistants alongside traditional search engines.
These technologies may need to interpret website content, understand page structure and interact with online information.
We believe clear, accessible and technically well-structured websites provide a sensible foundation for this evolving environment.
Our Agentic Browsing results
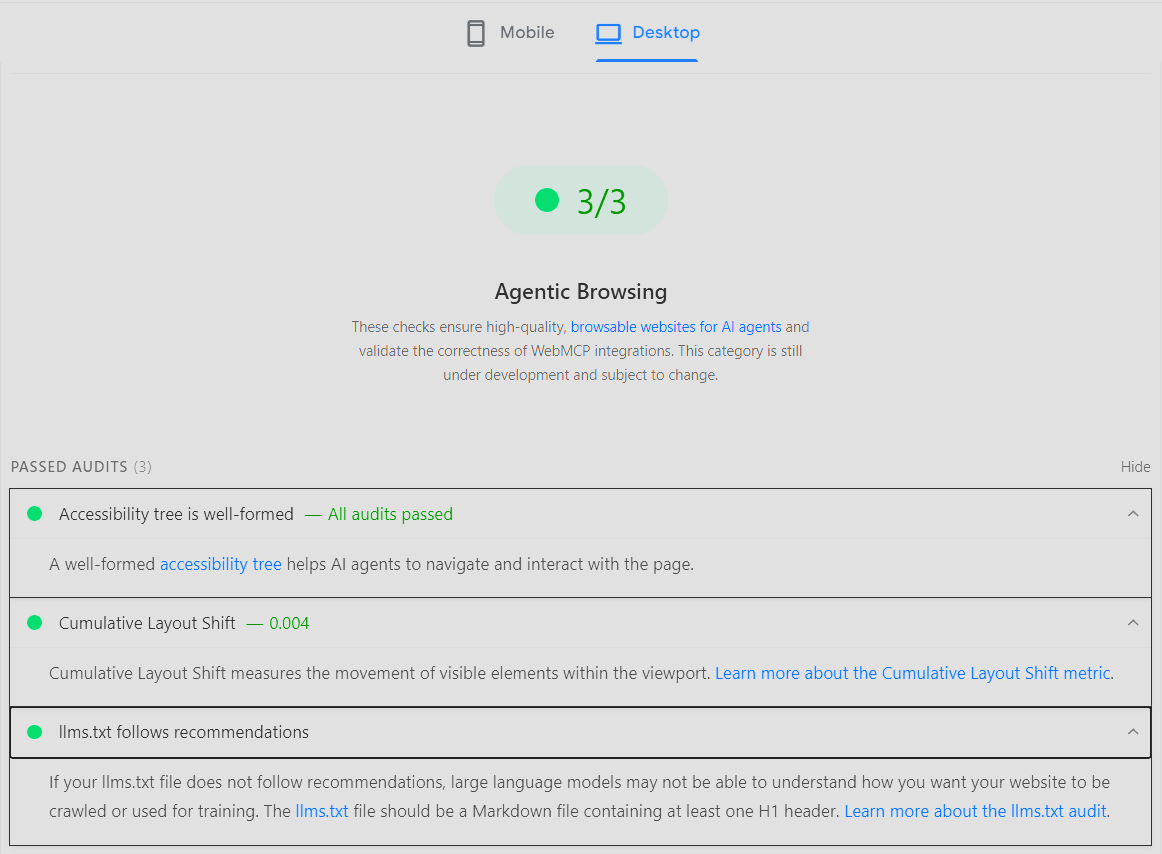
Illustrative screenshots from the 18 October homepage tests appear below; the original 14 October site-wide testing remains the primary evidence.
Across all 18 pages, on mobile and desktop, both testing tools recorded 3 out of 3 successful Agentic Browsing checks.
If columns extend beyond the screen, scroll within the table. Keyboard users can focus the table and use the arrow keys.
| Recorded audit | Result |
|---|---|
| Accessibility tree is well formed | Pass |
| Cumulative Layout Shift is zero | Pass |
| llms.txt follows recommendations | Pass |
The table retains the original audit labels. “Cumulative Layout Shift is zero” is the recorded check name, not a claim of literally zero measured CLS. See the visual-stability explanation below.
Overall: 72 assessments, each recording 3/3 successful checks.
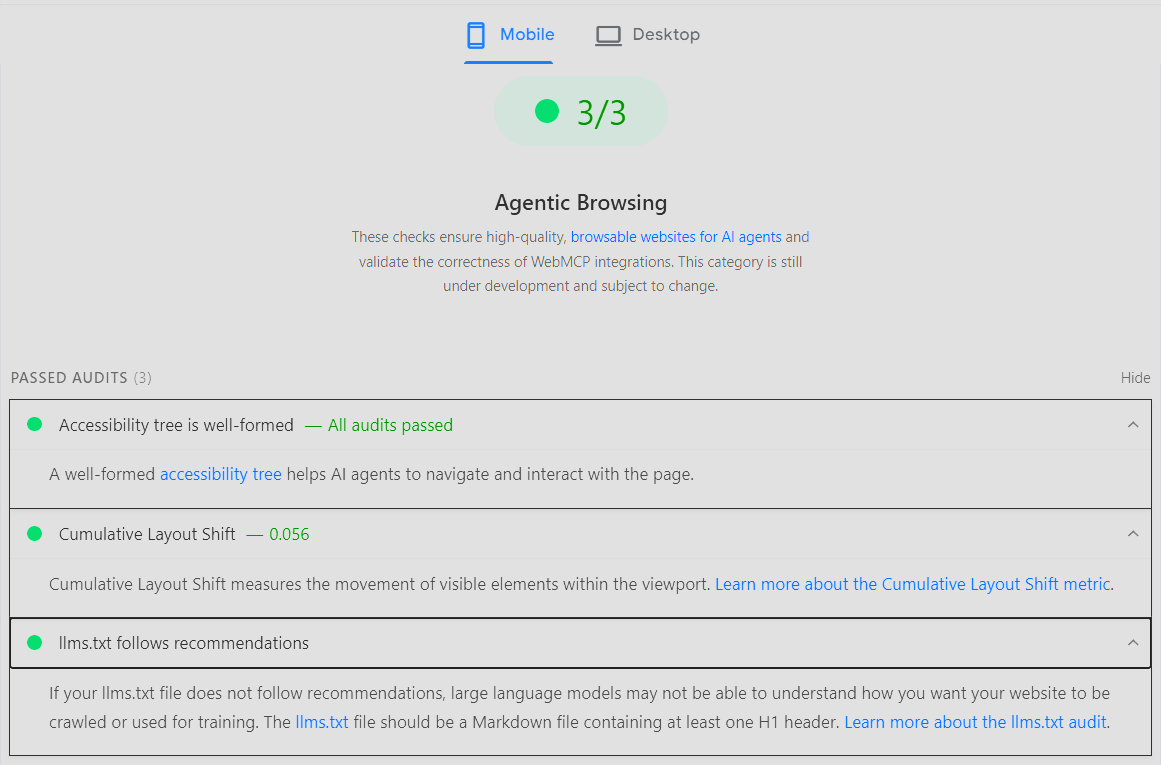
Homepage Agentic Browsing (mobile): three checks passed. Recorded CLS: 0.056.
Homepage Agentic Browsing (desktop): three checks passed. Recorded CLS: 0.004.
What these results mean
Accessibility tree
A well-formed accessibility tree provides structured information that can assist accessibility tools and automated systems in understanding a page.
Visual stability
The Agentic Browsing layout-shift check evaluates stability under its particular audit conditions. Passing does not necessarily mean the recorded shift is literally zero: the 18 October homepage screenshots show mobile CLS 0.056 and desktop CLS 0.004.
Its result is separate from the conventional Lighthouse Performance category's CLS measurement. Different checks can therefore report different outcomes.
LLMS.txt
The website's llms.txt file satisfied the recommendations included in the recorded audit.
This file is an emerging convention intended to provide information that may help AI systems interpret website content.
It is not a universal requirement for appearing in AI-generated search results.
What these results do not guarantee
Passing the three recorded checks does not prove that every AI assistant can successfully navigate the website.
Nor does it guarantee inclusion in AI-generated answers or improved AI search visibility.
The results demonstrate that our website satisfied the specific automated checks included in these assessments.
The customer benefit
Clear content structure, accessibility and sound technical implementation help make a website easier to interpret and maintain as digital technologies evolve.
7. How We Build and Maintain a High-Performance Website
Lightweight website development
On The Map Digital's website uses Eleventy, a static-site generator, to produce efficiently structured web pages.
This approach helps reduce unnecessary processing and dependence on large collections of plugins.
Responsive design
Our layouts are designed to adapt to different screen sizes, with attention to navigation, readability and interactive elements.
Efficient resource loading
We pay attention to image delivery, browser caching, font loading and the amount of JavaScript required.
Secure customer enquiries
Our website uses protected server-side form processing and Cloudflare Turnstile to help prevent automated spam submissions.
Independent backup and recovery
We have developed an encrypted backup and recovery system to support business continuity.
The system includes protected backup storage, recovery procedures and a private monitoring dashboard.
These operational safeguards are separate from Lighthouse scoring but contribute to our approach to website reliability and maintenance.
Continuous improvement
Performance is not something we consider finished when a website is launched.
We regularly assess technical quality, investigate findings and make carefully tested improvements where appropriate.
The customer benefit
A website built with performance and maintainability in mind can be easier to update, improve and support over time.
8. Testing Methodology, Verification and Transparency
What we tested
Our principal assessment was conducted on 14 October 2026.
If columns extend beyond the screen, scroll within the table. Keyboard users can focus the table and use the arrow keys.
| Assessment scope | Quantity |
|---|---|
| Website pages | 18 |
| Device categories | 2 |
| Testing tools | 2 |
| Total recorded assessments | 72 |
Each page was assessed using Google Lighthouse and Google PageSpeed Insights on mobile and desktop.
The testing records include Performance, Accessibility, Best Practices, SEO and Agentic Browsing results.
The principal results represent recorded laboratory assessments, rather than a continuous real-user monitoring programme.
The original results have been retained to preserve the testing history.
Accessibility correction: 18 October
Following the original assessment, we corrected the Website Maintenance pricing badge's colour contrast.
The correction was deployed and verified.
Fresh Lighthouse and PageSpeed Insights tests subsequently returned 100/100 accessibility on both mobile and desktop.
About Us desktop performance observation
The About Us page recorded a desktop PageSpeed Insights Performance score of 89/100, with CLS of approximately 0.225.
The original 14 October workbook recorded Lighthouse desktop Performance 99 and CLS 0.002. Separate local tests reported approximately 100 Performance with negligible CLS; these are not the same assessment.
A technical investigation examined the introduction section, header, navigation, font loading and Hostinger Partner badge.
The larger PageSpeed layout shift could not be reproduced in the independent browser tests.
Font substitution was identified as a possible contributor, but the evidence did not establish a conclusive cause.
Rather than make speculative changes that might affect other pages, we documented the finding for future monitoring.
What our testing does not establish
The assessment does not independently measure:
Changes in customer enquiries or sales.
Actual search ranking improvements.
Complete accessibility across all assistive technologies.
Comprehensive security compliance.
Real-user Core Web Vitals performance where separate field evidence is unavailable.
Successful completion of every possible automated or AI browsing task.
We believe it is important to distinguish what testing demonstrates from what would require additional evidence.
Independent verification
The website can be tested using Google PageSpeed Insights:
Website assessed:
https://onthemapdigital.co.uk/
Results may vary with time, browser environments, network conditions and website updates.
9. Common Questions About Website Performance
Why is my website slow on mobile but seems fine on my computer?
Mobile devices may have less processing power and slower connections than desktop computers.
Large images, unnecessary scripts, complex page builders and other resources can affect mobile performance.
Testing both device types helps identify these differences.
Does a faster website automatically rank higher on Google?
No.
Page experience is relevant to website quality, but search rankings depend on many factors, including content relevance, competition and usefulness.
Improving speed can help visitors use a website more comfortably, but it does not guarantee higher rankings.
What does a good PageSpeed score actually tell me?
It indicates how well a page performed against the measurements included in that particular test.
A high score is useful evidence of technical quality, but it does not automatically prove that a website generates enquiries, ranks well or meets every accessibility requirement.
What should a website performance check include?
A useful assessment should examine more than the homepage.
It should consider mobile and desktop performance, loading behaviour, visual stability, accessibility, technical SEO and relevant browser best practices.
The findings should be explained clearly, with practical recommendations where improvements are needed.
Why do Lighthouse and PageSpeed scores sometimes disagree?
Testing conditions can differ.
Browser environments, network conditions, caching, resource timing and other factors may influence the recorded result.
When results disagree, further investigation may be needed rather than assuming either result is incorrect.
How often should a business website be checked?
Testing is particularly valuable after substantial changes to design, images, scripts, navigation or third-party services.
Periodic reviews can also help identify new issues caused by software updates, changing content or external dependencies.
The appropriate frequency depends on how often the website changes and how important it is to the business.
10. What This Means for Your Business
Professional website design backed by measurable standards
A successful business website should make it easy for visitors to understand what you offer, find the information they need and get in touch.
Our October 2026 assessment demonstrates the technical standards behind On The Map Digital's own website.
For businesses in Northamptonshire and surrounding areas, we offer practical help with website design, technical assessments, repairs and improvements.
We understand that not every business needs a complete website rebuild.
Sometimes a targeted improvement is the most appropriate solution.
Our approach is to understand the problem, assess the evidence and recommend work proportionate to the business's needs and budget.
How we can help
Free Website Health Check
A starting point for understanding potential issues affecting your existing website.
Professional Website Audit
A more detailed assessment to identify technical problems and improvement opportunities.
Website Repairs and Improvements
Targeted work to address specific website issues where appropriate.
Website Design
Professional, responsive websites developed with performance, usability and technical quality in mind.
Ready to find out how your website performs?
If you're concerned about website speed, mobile usability or technical quality, we can help you understand where improvements may be worthwhile.
Start with a Free Website Health Check.
Visit onthemapdigital.co.uk/website-health-check/
On The Map Digital Website Design, Technical Quality and Google Business Profile Services
Northamptonshire and surrounding areas
Website Performance & Technical Quality Report, October 2026
The report documents the performance of On The Map Digital's own website. Results are not a guarantee of equivalent outcomes on customer websites.
APPENDIX A / ADDITIONAL QUESTIONS
Practical answers to common questions from small-business owners.
A1. How can I tell whether my website makes it difficult for customers to contact me?
Try following the same journey a potential customer would take.
Open your website on a mobile phone, find a service, locate the contact information and attempt to complete an enquiry.
Look for problems such as confusing navigation, hard-to-read text, small buttons, lengthy forms or contact details that are difficult to find.
Performance testing can identify some technical problems, but evaluating the complete customer journey requires additional usability testing.
A2. Can my existing website be improved, or does it need rebuilding?
Not every poorly performing website needs replacing.
Many problems can be corrected through targeted improvements, such as image optimisation, layout adjustments, navigation changes or removal of unnecessary scripts.
A rebuild may be more appropriate when the existing website has fundamental structural problems, outdated technology or significant limitations that make repairs uneconomical.
A professional assessment should help establish which option offers better value.
A3. What should I fix first if my budget is limited?
Prioritise problems that prevent customers from using your website effectively.
For example, a broken contact form or unusable mobile navigation would normally deserve attention before a minor improvement to an already good performance score.
A sensible order is to address critical functionality, accessibility barriers, major loading problems and then lower-priority refinements.
The correct priorities depend on the website and its business purpose.
A4. How much does a website performance review or repair cost?
The cost depends on the depth of the assessment and the work required.
On The Map Digital offers:
Free Website Health Check: An initial review of potential website issues.
Professional Website Audit (£79): A more detailed assessment.
Website Repairs and Improvements (from £95): Targeted work based on the problems identified.
A full website rebuild is quoted separately according to the project's requirements.
An initial assessment can help avoid unnecessary expenditure by identifying whether a targeted repair is sufficient.
A5. How can I tell whether my website is losing potential enquiries?
Website performance scores alone cannot establish whether customers are abandoning your website.
Useful evidence may include analytics showing where visitors leave, enquiry-form completion rates, contact-button interactions and customer feedback.
These measurements can help identify where visitors experience difficulties.
However, a reduction in enquiries may have several causes, including changes in search demand, competition or the relevance of website content.
A6. Does my website need to be accessible if I'm only a small business?
Accessibility matters for businesses of every size.
Visitors may have visual, hearing, motor or cognitive impairments, or may use assistive technologies to browse the web.
Accessible design can also benefit people using mobile devices, smaller screens or unfamiliar interfaces.
Automated tools can identify some barriers, but manual testing is needed for a more complete assessment.
A7. What is the difference between technical SEO and website performance?
Website performance focuses on factors such as loading speed, responsiveness and visual stability.
Technical SEO concerns how effectively search engines can discover, crawl, interpret and index website content.
The two areas overlap, particularly around mobile usability and website structure, but they are not interchangeable.
A fast website can still have poor SEO, just as a technically search-friendly website can have performance problems.
A8. Will AI search engines understand my website if it passes Agentic Browsing checks?
Passing Agentic Browsing checks is encouraging, but it does not guarantee that AI-powered systems will understand every page or successfully complete every task.
Clear content, semantic HTML, accessible navigation and appropriate structured data can help make information easier for automated systems to interpret.
AI search visibility also depends on factors outside these technical assessments.
A9. What happens after a website performance issue has been fixed?
The correction should be tested to confirm that it resolves the original problem without creating new issues.
For example, a colour-contrast correction should be checked against accessibility requirements, while a layout change should be reviewed across relevant screen sizes.
Where appropriate, the updated website should then be retested using the original assessment tools.
Keeping a record of the original issue, correction and verification results helps demonstrate continuous improvement.
Concerned about your own website's performance?
Find out where improvements could make a difference. Start with a Free Website Health Check at onthemapdigital.co.uk.
Appendix B: Results for the 18 assessed pages
Original 14 October 2026 workbook. Entries show Performance scores out of 100. Each page was also assessed for Accessibility, Best Practices and SEO. All recorded Best Practices and SEO scores were 100. Website Maintenance accessibility was 96 in all four original assessments; later retests were reported as 100 in workbook comments.
All 18 assessed pages are listed below. On smaller screens, scroll the table horizontally to read all four tool/device scores. Keyboard users can focus the table region and use the arrow keys.
| Website page | LH mobile | LH desktop | PSI mobile | PSI desktop |
|---|---|---|---|---|
| Homepage | 98.0 | 99.0 | 96.0 | 100.0 |
| Website Design Portfolio | 98.0 | 100.0 | 95.0 | 100.0 |
| About Us | 99.0 | 99.0 | 100.0 | 89.0 |
| Contact Us | 98.0 | 100.0 | 100.0 | 99.0 |
| Services | 100.0 | 100.0 | 96.0 | 100.0 |
| Website Design for Tradesmen | 99.0 | 100.0 | 100.0 | 100.0 |
| Website Repair Service | 99.0 | 100.0 | 100.0 | 100.0 |
| Website Maintenance | 97.0 | 93.0 | 100.0 | 97.0 |
| Free Website Health Check | 99.0 | 100.0 | 98.0 | 100.0 |
| Website Audit | 100.0 | 98.0 | 100.0 | 100.0 |
| Google Business Profile | 99.0 | 100.0 | 100.0 | 100.0 |
| Privacy Policy | 100.0 | 100.0 | 100.0 | 100.0 |
| Terms & Conditions | 100.0 | 100.0 | 100.0 | 100.0 |
| Website Design Northampton | 100.0 | 98.0 | 91.0 | 99.0 |
| Website Design Milton Keynes | 100.0 | 100.0 | 100.0 | 100.0 |
| Website Design Bedford | 99.0 | 100.0 | 100.0 | 100.0 |
| Website Design Wellingborough | 99.0 | 100.0 | 100.0 | 99.0 |
| Website Design Kettering | 99.0 | 99.0 | 99.0 | 99.0 |
Evidence note: The About Us PSI desktop entry is 89 with recorded CLS about 0.225. Its cause remains unconfirmed. These are original workbook entries, not current live results.
Evidence notes and report download
This HTML report follows the approved 24-page October 2026 PDF. The 14 October batch and supplementary 18 October examples are separate assessments. Historical results are not current live measurements.
The original results table includes Performance scores only. Accessibility, Best Practices and SEO qualifications remain in the accompanying report text.
Open the approved full technical report (PDF, 24 pages) or download a copy.
Source: OTMD_Website_Performance_Technical_Quality_Report_FINAL.pdf. The downloadable PDF preserves the approved file’s original bytes.