
LighthouseMobile
99.1 / 100
How we tested our own website, what the results show, and why website quality matters to your customers.
18 assessed pages · 72 recorded assessments
Tested with Google Lighthouse and PageSpeed Insights.
Primary testing: .
Supplementary checks: .
Performance scores are averages across the 18 assessed pages for each tool and device, from the 14 October assessments.
99.1 / 100
99.2 / 100
98.6 / 100
99.0 / 100
100/100 for SEO and Best Practices in all 72 recorded assessments.
These are averages of individual test results, not separate Google-issued site-wide ratings. A high test score shows technical quality, not guaranteed rankings or sales.
Lighthouse score guide: 90–100 Good · 50–89 Needs improvement · 0–49 Poor.
Technical results matter most when they improve the visitor experience.
A well-built page helps people see your services without unnecessary waiting.
Readable content, clear navigation and stable buttons make mobile browsing easier.
Simple routes to contact details and forms help visitors take the next step.
These are potential usability benefits, not measured increases in enquiries or sales.
The homepage Lighthouse mobile laboratory test recorded Largest Contentful Paint (LCP) of 1.3 seconds. PageSpeed Insights recorded 2.7 seconds on mobile. Different testing environments can produce different results.
LCP measures when the largest visible content element appears; it is not the time for the entire page to finish loading.
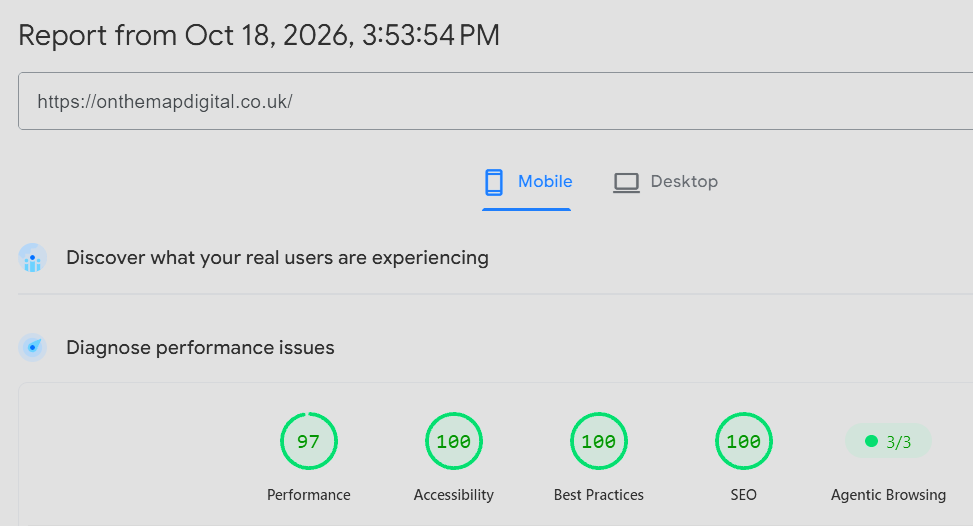
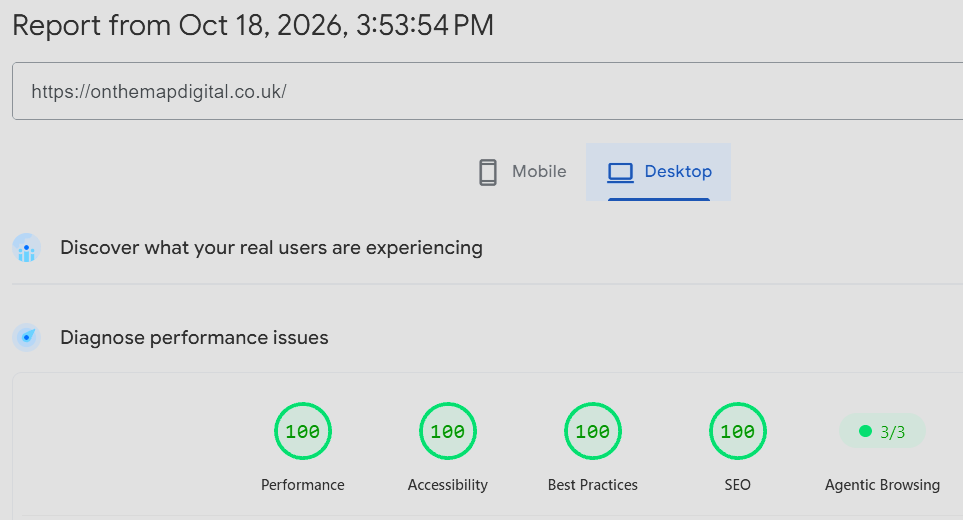
The approved summary records homepage Performance of 97/100 on mobile and 100/100 on desktop. These examples are separate from the 14 October averages above.
Core Web Vitals describe loading, responsiveness and visual stability. Here is what the metrics mean.
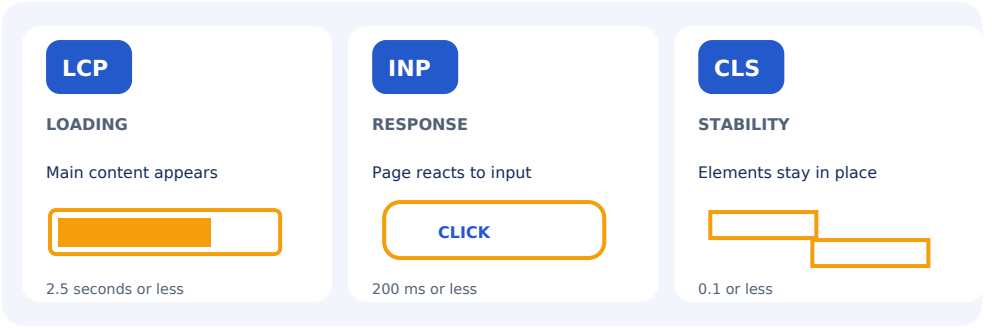
Metrics explained are not all metrics measured. Our recorded laboratory assessments include LCP and CLS. They do not establish real-user INP or a real-user Core Web Vitals pass.
We assessed 18 website pages using two Google tools on mobile and desktop: 18 pages × 2 devices × 2 tools = 72 recorded assessments. The principal results are laboratory assessments, rather than continuous real-user monitoring.
One Website Maintenance pricing badge initially failed a colour-contrast check. We corrected it, improving contrast from 3.02:1 to 5.78:1.
The original 14 October Accessibility score was 96/100 for that page in all four assessments. Supplementary 18 October retests were recorded as 100/100 on mobile and desktop in both tools. Those later results are recorded in workbook comments and are separate from the original scores.
They do not prove increases in enquiries, higher Google rankings or complete accessibility. Automated accessibility checks do not replace manual testing.
Our own website is a working example, not a promise of identical client scores. Our site uses Eleventy; client sites may use different technology.
A desktop PageSpeed test also recorded an unresolved layout shift on About Us. Its cause remains unconfirmed.
Not every slow or awkward website needs rebuilding. We can assess the problem first and recommend proportionate improvements.
Find out whether loading speed, mobile usability or technical issues could be affecting the experience your customers receive.